Netsight Analytic Dashboard
Netsight Analytic Dashboard

Key Feature Netsight Analytic Dashboard
Monitor and diagnose network, content, and user experience.
Data processing center for Netsight Edge and Netsight Remote.
Validate deployment before launching the application.
Route and hop-by-hop identification with diagram and geolocation map view to recognize thebest path.

Summary Performance
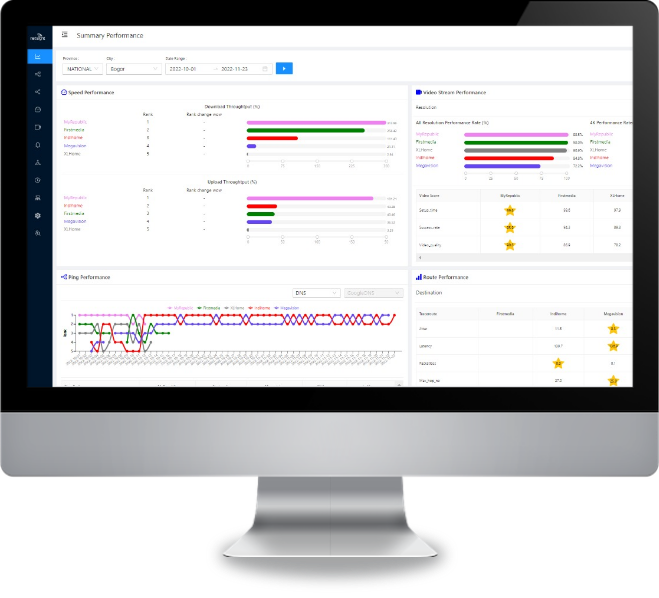
Performance Summary is a summary or report of the measurement results of Ping Performance, Route Performance, Speed performance and Video Performance. In this menu you can show the ranking of providers in each measurement.

Ping Performance
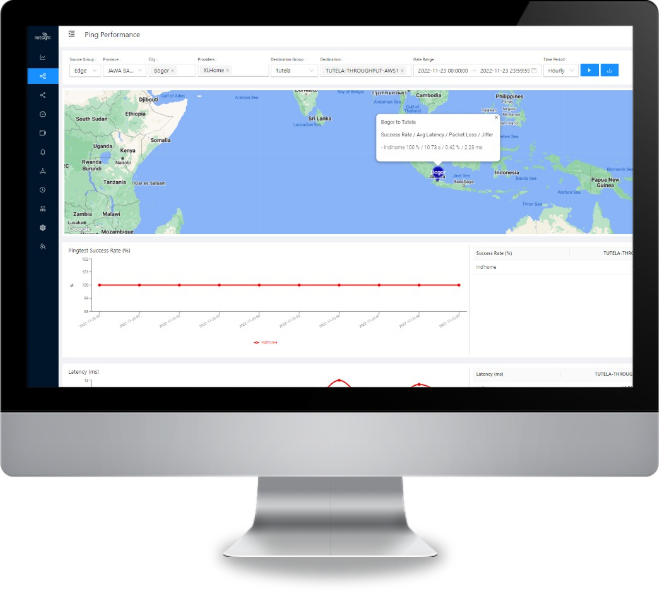
Ping Performance is a menu to display the results of Latency, Packet Loss and Jitter measurements performed by Netsight Edge and Netsight Remote to the target IP address presented in graphical form.


Route Performance
Route Performance is a menu to display traceroute results to the measurement target IP, the information obtained is the target IP hop by hop information, packet loss and latency per hop. On the Route Performance page there is 1 split menu which functions to divide the layer into 2 parts, which can be used to view upstream/downstream traceroute results.

Speed Performance
Speed Performance is a menu to display the speedtest measurement results from each fixed broadband provider. Measurement results can be displayed in 2 types, namely in units of percent or Mbps. For percent units, the calculation is obtained from the speed obtained in Mbps divided by the bandwidth commitment configured in the Device Settings menu for each fixed broadband provider.


Video Performance
Video Performance is a menu that functions to display the measurement results of Youtube video streaming for each provider and also to perform Benchmarking between one provider and another.
